

How to Read Stock Charts (Adapted from the Mint.com - a division of the Northwestern Mutual Foundation)
Using Yahoo Finance, you will choose a few stocks, interpret their trading information and follow their activity over the next week. The terms below will help you understand the abbreviations, words, and phrases you will find in Yahoo's stock market listing.
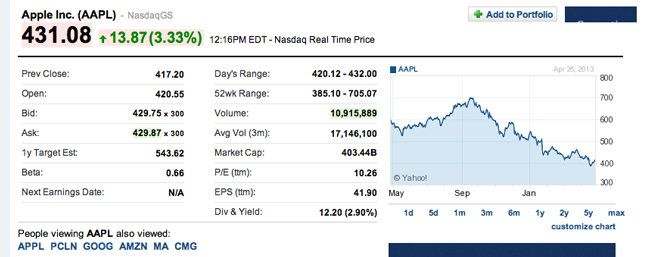
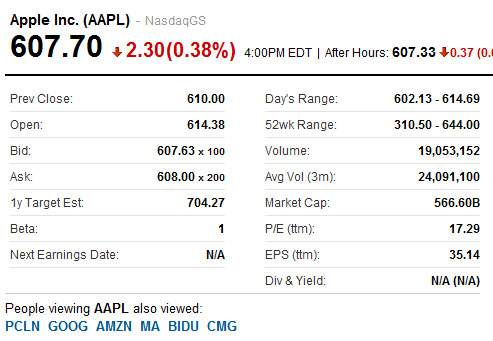
Example of Apple Stocks from May 2012 (below) and May 2013 (above)
To do - you are to choose 5 different publicly traded stocks
- they can be ones you know about like Nike (NKE),Google (GOOG), Starbucks (SBUX), or ones that are listed below
- also know that some companies are privately owned and you will not be able to find (In and Out).
- You will each track information on a daily basis on them for the next 5 days.
- See below of what information to find and how to set up your table
Copy and Paste the following table into a Word document - save this document at 5_stocks you will need to fill it out each time for each of the five stocks you choose. Place on your worklinks as well.
Fill out the following table for each of your stocks - you will update them on a daily basis (close, etc):
| Full Name | ||||||
| Symbol | ||||||
| What stock exchange? | ||||||
Monday |
Tuesday |
Wednesday |
Thursday |
Friday |
||
| Previous close | ||||||
| 1y target est | ||||||
| Days Range | ||||||
| 52 week Range | ||||||
| Volume | ||||||
| Market Cap | ||||||
| P/E | ||||||
| EPS |
|
|||||
| Div Yield | ||||||
| Why this stock? | Comments here:
|
|||||
Answer these questions at the bottom of your 5 table document.
- What company had the most shares traded over the course of the week?
- What does the closing price of a stock tell you based on its performance?
- Is the closing price on these days closer to the high or the low for the year?
- Of the stocks you've chosen, which pays the highest dividend?
- Of the stock you've chosen, which is the most stable?
- What does the P/E ratio indicate about each stock?
- First is the full name of the company
- The initials listed are the Symbol used by the company on the ticker reports generated by the stock exchanges that track the trading of each stock. This is followed by the market it is traded on (for example, Apple is traded on the NASDAQ
- Prev Close shows the stock's price at close of business yesterday.
- Open shows what the stock open at today (shows any after market trading)
- 1y Target Est - how much people in the know think the stock will be worth on this same day one year from now.
- Day's Range how much the stock has been bought and sold for over the course of the day
- 52wk Range shows the lowest selling price of the stock in the last 52 weeks and the highest selling price of the stock in the last 52 weeks (which is = to 1 year).
- Volume lists the number of shares sold (in hundreds) during the days trading.
- Market Cap is the The total dollar market value of all of a company's outstanding shares - calculated by multiplying a company's shares outstanding by the current market price of one share. The investment community uses this figure to determine a company's size, as opposed to sales or total asset figures.
- PE (price/earnings) ratio: the price of a share of stock divided by the company's earnings (profits) per share for the last 12-month period.
- EPS - The portion of a company's profit allocated to each outstanding share of common stock. Earnings per share serves as an indicator of a company's profitability (high EPS is good)
- The dividend yield is the amount of dividends received per share of stock compared to the price of a share of the stock. The yield is calculated by dividing the dividend per share of stock by the last (closing) price and then multiplying by 100 to obtain a percentage.
